Lineage
Precise down to the column
A table graph tells you two systems are related. It does not tell you which column arrives where, or which of the two writers put it there.
Most catalogues stop at the table. The interesting question is usually one level down: which column, from which writer, and through which transformation.
-
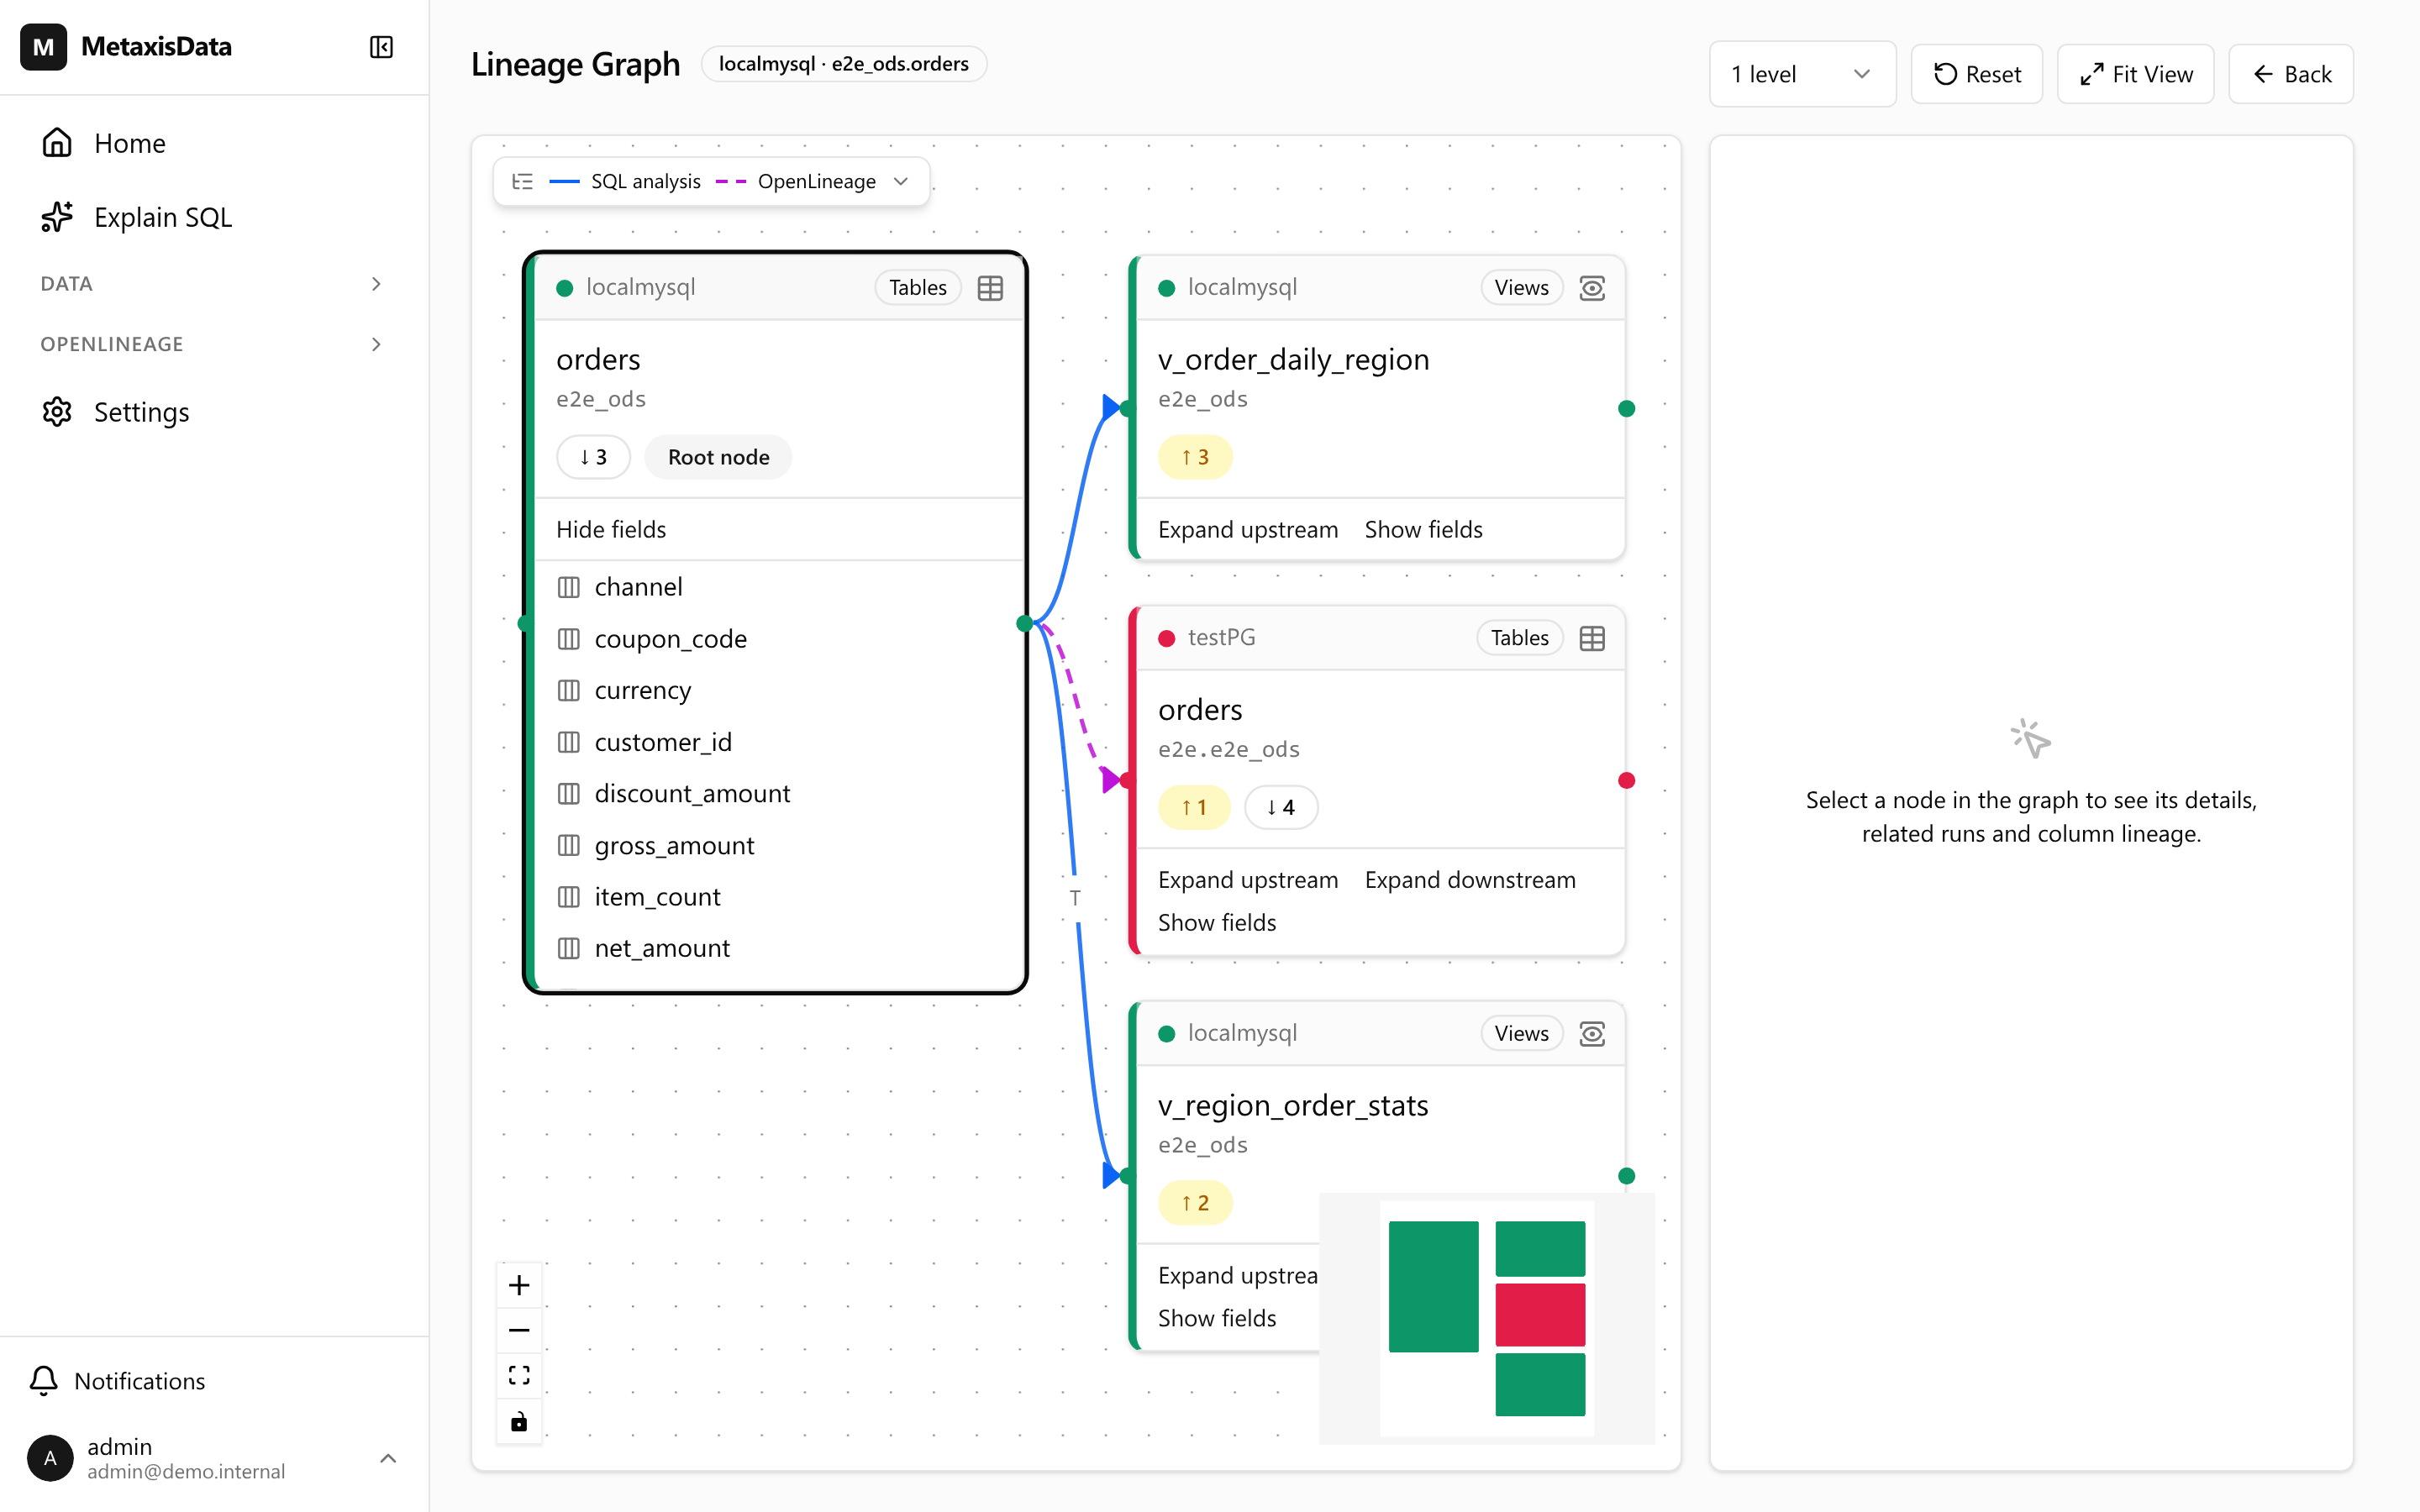
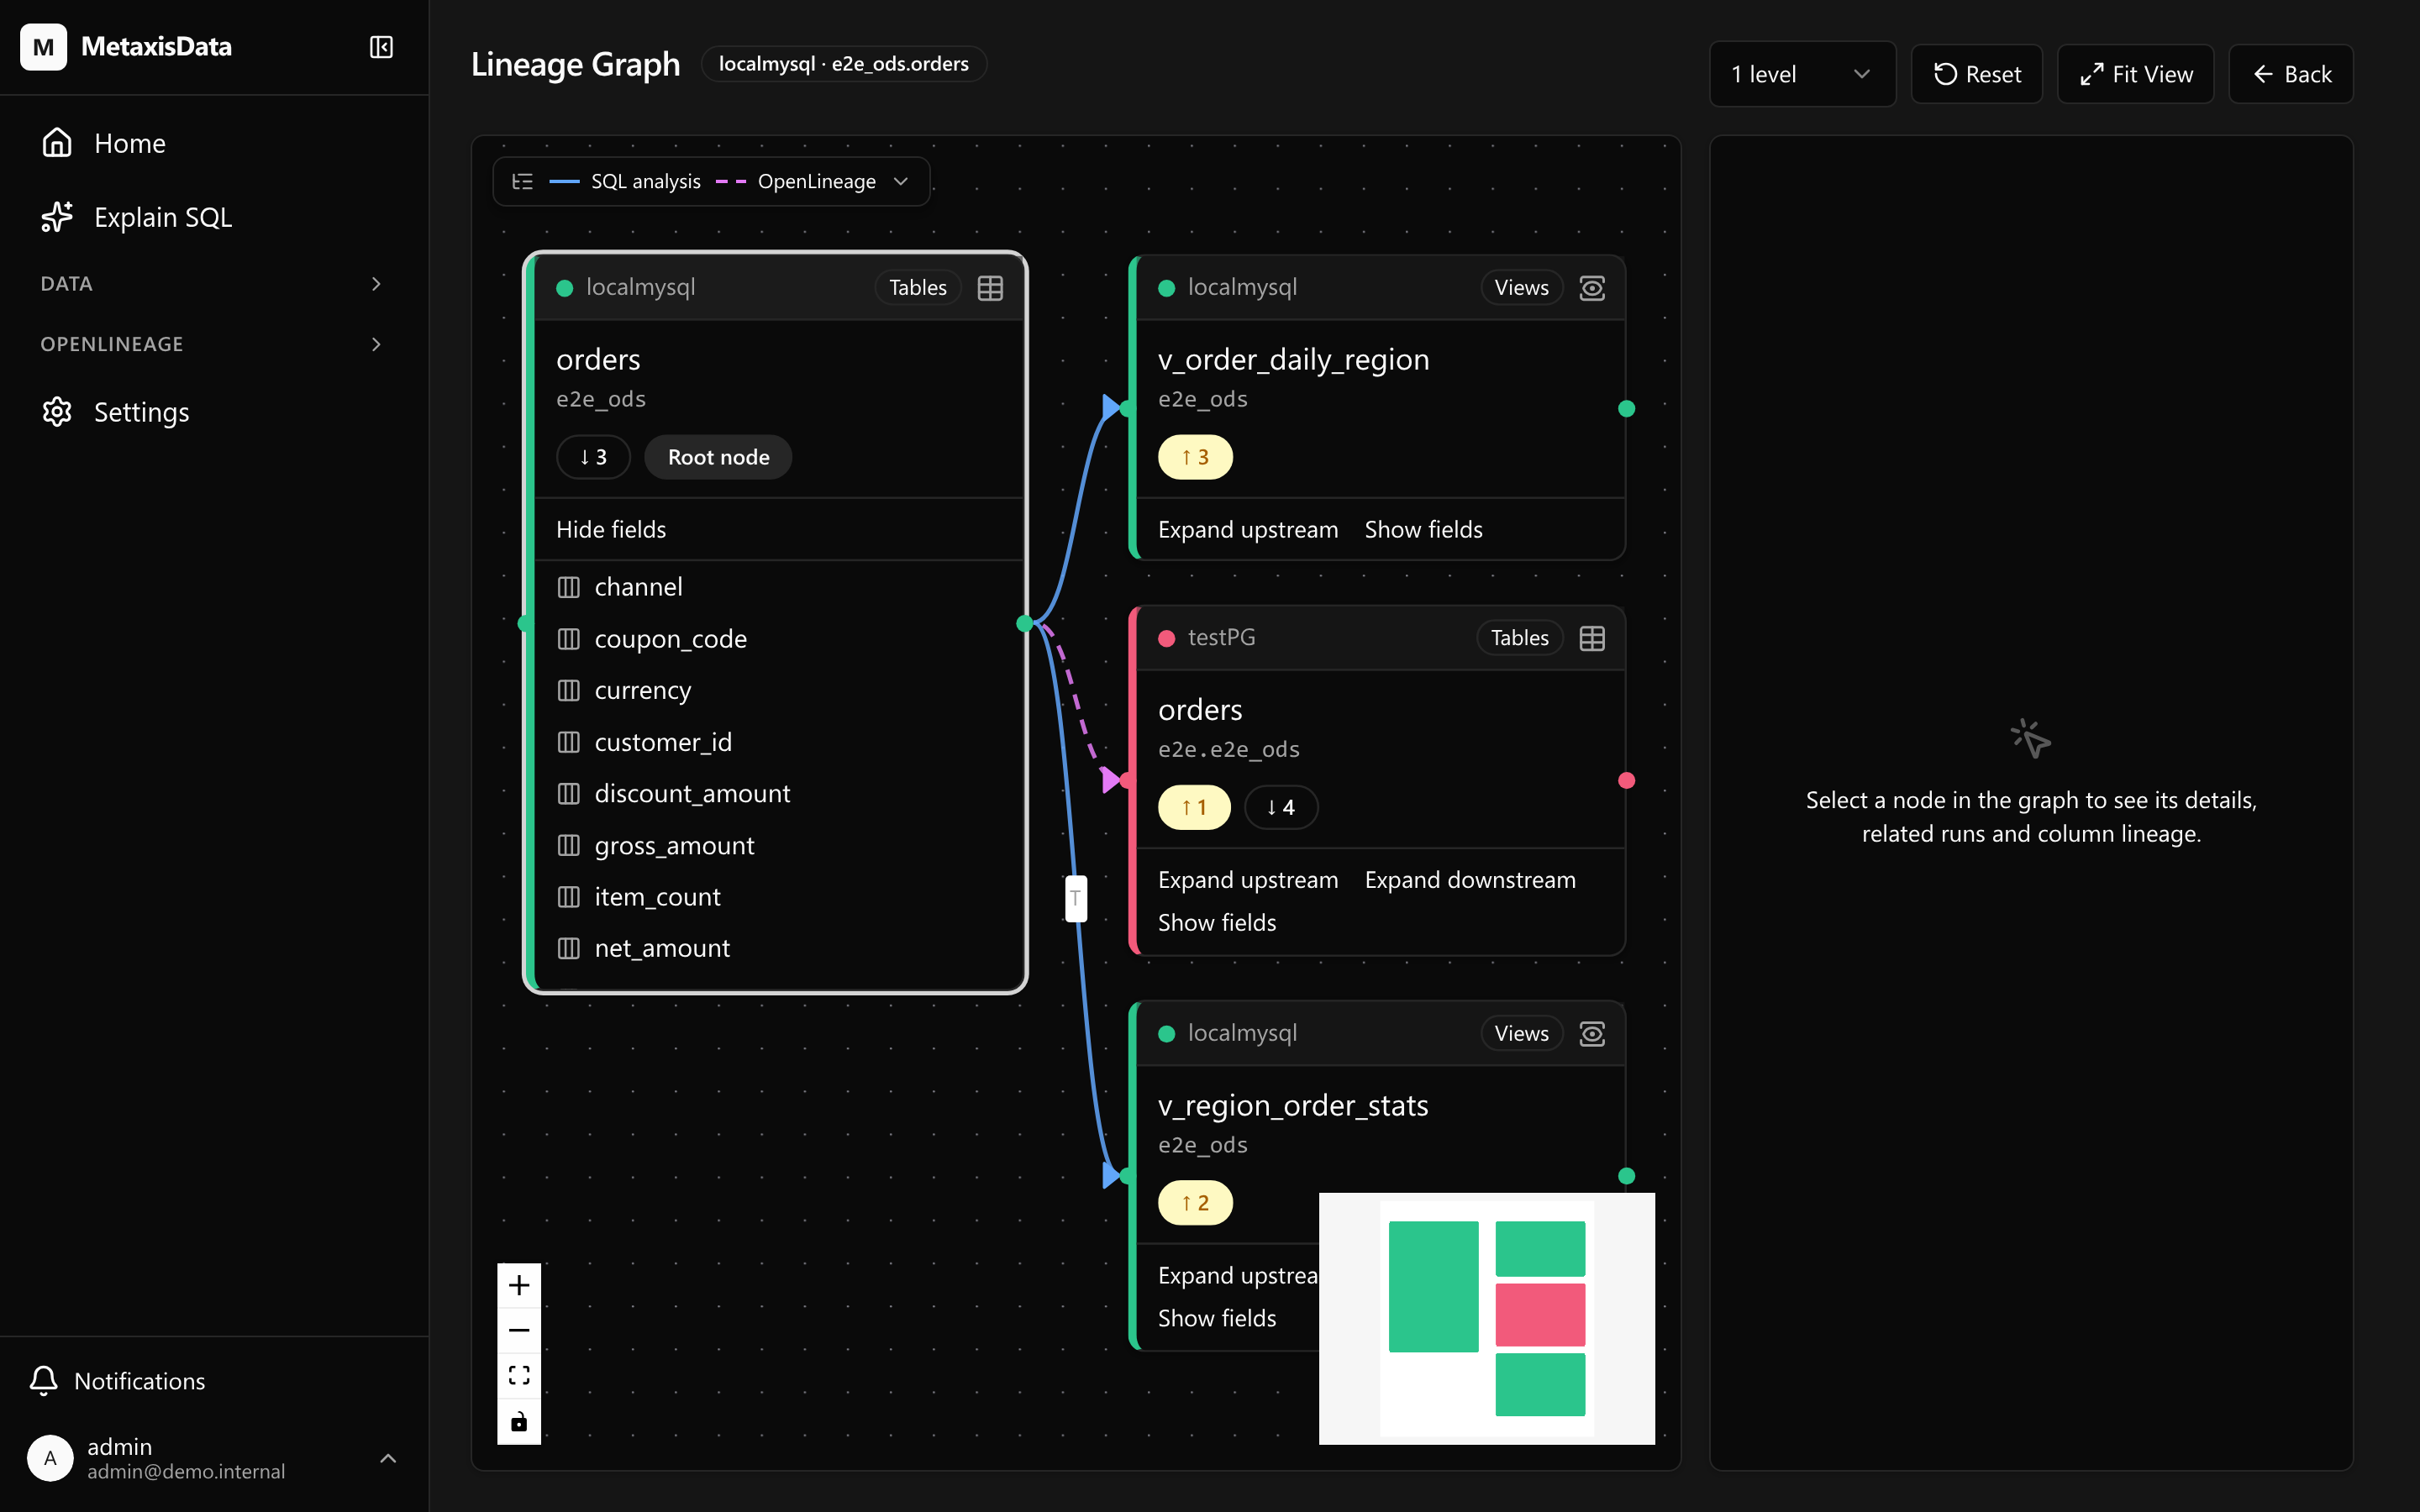
Two sources, one graph
Edges analyzed from view definitions, materialized views and manual SQL are drawn solid; edges ingested from OpenLineage events are dashed. An object written by both is drawn a third way, so a node's scope and an edge's origin never read as the same thing.
-
Instances keep their colour
Objects in different instances can share a database, schema and table name. Each instance takes one accent from a palette that clears the WCAG graphics floor against the canvas, and the colour is a backup — line style carries the same information, so the graph stays readable in greyscale.
-
Follow one column
Select a field to see its upstream and downstream trail, the relations it passes through, and the OpenLineage runs that touched it. Temporary relations exist only inside a statement and are hidden by default, with a count reported when that would otherwise leave an empty result.
Known limits
- Relations that exist only inside a statement are hidden by default; the count is reported so an empty result never reads as “no lineage”.
- The graph is drawn from analyzed statements, not inferred from naming or timing.